Loading
The policy rate
184 changes since Oct 1982
94 hikes · 90 cuts · now 3.75–4%
the target rate since 1982 · scroll for other years · pinch to zoom
Headlines
Highest
11.5%
Aug 1984 – Sep 1984
Lowest
0–0.25%
Dec 2008 – Dec 2015 · Mar 2020 – Mar 2022
Longest hold
7 years
Dec 2008 – Dec 2015
Longest run of hikes
17 in a row
Jun 2004 – Jun 2006
Longest run of cuts
24 in a row
Jun 1989 – Sep 1992
Changes
By Chair
| Chair | Years | Meetings | Hikes | Cuts | Rate | Net |
|---|---|---|---|---|---|---|
| Paul A. Volcker | 1982–1987 | 51 | 22 | 23 | 10% → 6.63% | −338 bp |
| Alan Greenspan | 1987–2006 | 215 | 48 | 46 | 6.63% → 4.5% | −213 bp |
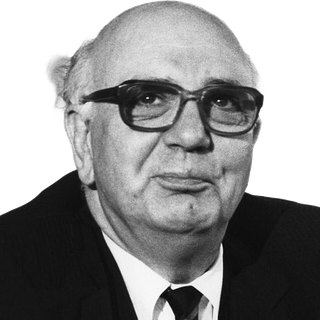

By President
| President | Years | Hikes | Cuts | Rate | Net |
|---|---|---|---|---|---|
| Ronald Reagan | 1982–1989 | 38 | 26 | 10% → 9% | −100 bp |
| George H. W. Bush | 1989–1993 | 4 | 24 | 9% → 3% | −600 bp |
| Bill Clinton | 1993–2001 | 14 | 7 | 3% → 6% | +300 bp |
| George W. Bush | 2001–2009 | 17 | 22 | 6% → 0–0.25% |
Through each recession
| Recession | Months | Hikes | Cuts | Rate | Net |
|---|---|---|---|---|---|
| 1981–82 | Jul 1981 – Nov 1982 | 0 | 2 | 10% → 9% | −100 bp |
| 1990–91 | Jul 1990 – Mar 1991 | 0 | 8 | 8.25% → 6% | −225 bp |
| 2001 | Mar 2001 – Nov 2001 | 0 | 8 | 5.5% → 2% | −350 bp |
| 2007–09 | Dec 2007 – Jun 2009 | 0 | 8 | 4.5% → 0–0.25% | −438 bp |